Zinc * USD/lb
0.00
Multiple high-grade intercepts including up to 2.4 g/t Palladium, 1.72 g/t Platinum and 0.12 g/t Gold over 4 metres within a broad zone of disseminated PGM - Copper Mineralization
Toronto, Ontario - August 17, 2021 - Generation Mining Limited (TSX: GENM; OTCQB: GENMF) (“Gen Mining” or the “Company”) is pleased to announce results from the summer drill program of the Central Feeder Zone immediately adjacent to the Marathon palladium-copper deposit in Northwestern Ontario (the “Marathon Project”). In Q1-2021 the Company completed a positive feasibility study (see March 3rd, 2021 news release) which contemplates the development of an open-pit mining operation with robust project economics over a 13-year mine-life. Current exploration activities are focused on evaluating the potential for high grade, ramp accessible resources which could, in the future, potentially extend the life of the proposed operation. The 2021 summer exploration drill program is a continuation of the early 2021 winter (see May 10th, 2021 news release) program which also intersected multiple high-grade intercepts. The summer exploration drill program was designed to test along strike and down dip to gain insight into the geometry of the Central Feeder Zone (“CFZ”) as well as the continuity of higher-grade intervals within the CFZ.
Seven holes, in aggregate 3,727 m, were drilled as 50 m to 75 m step outs from earlier holes that were drilled in the CFZ. Results are tabulated in Table 1
Figure 1 is a location map of the CFZ area at the western margin of the Marathon Palladium Deposit showing the location of the seven 2021 summer drill holes and the location of section 5404700N. Figure 2 is a cross section at 5404700N and Figure 3 is a schematic 3D vertical section (or long section view) looking east and parallel to the plane of the cross section. On figures 2 and 3 only results from the best two mineralized intervals are plotted. In all instances drill intercept lengths approximate true widths.
All seven holes tested targets down dip and outside of the resource pit margin. Holes M-21-555 and M-21-556 were collared east of the pit margin due to surface access limitations. Hole-21-555 intersected an interval of mineralized oxide melatroctolite near the top of the hole. Additionally, an interval of semi-massive sulfides was also intersected near the bottom of the hole at a shallower depth than anticipated. The target depth was estimated from conductive plate modeling of down-hole pulse electromagnetic (“DHPEM”) survey results from a nearby hole that was surveyed during the winter drilling program. Neither interval has been incorporated into the existing resource estimate. Similarly, Hole M-21-556 also tested a DHPEM target. Although no massive or semi-massive sulphides were intersected in this hole there are two disseminated mineralized intervals which occur over the anticipated conductive target depth range.
Results are consistent with, and similar to, the results of the winter exploration drilling program. In the upper part of each hole there exists an interval or intervals of mineralized oxide melatroctolite (a magnetite bearing ultramafic rock) ranging from 2 to 12 metres in thickness. The oxide melatroctolite comprises approximately 2% of the Marathon Deposit mineral deposit resource inventory and is situated in the hanging wall of the Marathon Deposit. Several holes also intersected minor hanging wall mineralization which consists of thin veinlets of Main Zone-type mineralization (disseminated sulphides in Two Duck Gabbro) invading barren hanging wall. In the lower part of each hole there exists W-Type mineralization (similar to Main Zone mineralization but with a lower copper to platinum group elements ratio) averaging 4 m thick underlain by a broader interval of Main Zone mineralization averaging 40 m in thickness. W-type mineralization is an example of sulphide upgrading, where the concentration of platinum group elements (“PGE”) are increased relative to copper, a process which was recognized at the Norilsk Deposit in Siberia and which is also evident at the Marathon Deposit.
Since the Company discovered the CFZ in 2019 (see December 6th, 2019 news release), with drill holes M-19-537 and M-19-538, Gen Mining has drilled a total of 24 holes into the CFZ. These holes define two stacked mineralized horizons comprising a high-grade W-type horizon which averages 4 m in thickness and an underlying interval of Main Zone-style mineralization which averages 40 m in thickness. Both horizons form a broad zone of mineralization which extends some 300 m down dip from and 230 m below the currently defined resource pit shell (as shown on Figures 2 and 3) and is some 200 m along strike (width). Drill density spacing within this broad zone of mineralization is 50 m to 75 m which is sufficient to undertake preliminary resource calculations should future circumstances warrant.
With the lifting of the stop work order issued by the Ontario Ministry of Energy, Northern Development and Mines (see August 12th, 2021 news release) the Company will shortly resume drill testing the Chonolith area situated immediately north of, and contiguous with, the Marathon Deposit (see inset location map in Figure 3). Three holes were drilled prior to the stop work order and core from these holes has been logged and split and samples have been sent for assay. Results are expected within the next two weeks. These holes were drilled to follow up a 2006 hole which returned 100.5 metres grading 0.93 grams per tonne palladium, 0.584 % copper, 0.1 g/t gold and 0.25 g/t platinum, starting at a depth of 215.8 metres. Nine additional holes are planned for this zone when drilling resumes.
Gen Mining’s CEO Jamie Levy stated, “since acquiring the 220 sq. km Marathon property in 2018 we have simultaneously focused on the development of the Marathon Deposit as well as advancing the various exploration targets on the property. Current exploration results continue to reinforce the potential of the property.”
Quality Assurance/Quality Control
Quality assurance and quality control (“QA/QC”) protocols for the 2021 drilling assay program were unchanged from previous years and involve a rotating inclusion of one duplicate, blank, low-grade standard and high-grade standard every 15 samples. All controls are checked to be within a working limit of 2 standard deviations. Sample intervals are selected in 1 m or 2 m lengths dependent on the nature of the mineralized zone. The core samples are split on site using a diamond saw where half of the core is sent for analysis and the other half is securely stored on site for future reference. All samples are shipped to ALS in Thunder Bay for processing.
Qualified Person
Rod Thomas, P.Geo., Company Vice-President Exploration and a Director has reviewed and approved the scientific and technical information contained in this news release. Mr. Thomas is a Qualified Person for the purposes of National Instrument 43-101 Standards of Disclosure for Mineral Projects.
About the Company
Gen Mining’s focus is the development of the Marathon Project, a large undeveloped platinum group metal mineral deposit in Northwestern Ontario. The Company released the results of the Feasibility Study on March 3, 2021 and published the NI43-101 Technical Report dated March 25, 2021. The Marathon property covers a land package of approximately 22,000 hectares, or 220 square kilometres. Gen Mining currently owns an 82.6% interest in the Marathon Project, with the remaining interest owned by Sibanye-Stillwater.
The Feasibility Study estimated that at US$1725/oz palladium, and US$3.20/lb copper, Marathon’s Net Present Value (at 6% discount rate) is approximately C$1.07 billion with a payback of 2.3 years and an Internal Rate of Return of 30%. Up front capital costs were estimated at C$665 million. The mine would produce an estimated 245,000 palladium equivalent ounces per year over a 13-year mine life at an All In Sustaining Cost of US$809 per palladium-equivalent ounce. For more information, please review the detailed Feasibility Study dated March 25, 2021, filed under the Company’s profile at SEDAR.com.
For further information please contact:
Jamie Levy
President and Chief Executive
Officer
(416) 640-2934
(416) 567-2440
[email protected]
Forward-Looking Information
This news release contains certain forward-looking information and forward-looking statements, as defined in applicable securities laws (collectively referred to herein as “forward-looking statements”). Forward-looking statements reflect current expectations or beliefs regarding future events or the Company’s future performance. All statements other than statements of historical fact are forward-looking statements. Often, but not always, forward-looking statements can be identified by the use of words such as “plans”, “expects”, “is expected”, “budget”, “scheduled”, “estimates”, “continues”, “forecasts”, “projects”, “predicts”, “intends”, “anticipates”, “targets” or “believes”, or variations of, or the negatives of, such words and phrases or state that certain actions, events or results “may”, “could”, “would”, “should”, “might” or “will” be taken, occur or be achieved, including statements relating to future exploration of the Marathon Project, and advancing the Marathon Project to bring the project into production. All forward-looking statements, including those herein are qualified by this cautionary statement.
Although the Company believes that the expectations expressed in such statements are based on reasonable assumptions, such statements are not guarantees of future performance and actual results or developments may differ materially from those in the statements. There are certain factors that could cause actual results to differ materially from those in the forward-looking information. These include commodity price volatility, continued availability of capital and financing, uncertainties involved in interpreting geological data, increases in costs, environmental compliance and changes in environmental legislation and regulation, the Company’s relationships with First Nations communities, exploration successes, and general economic, market or business conditions, as well as those risk factors set out in the Company’s annual information form for the year ended December 31, 2020, and in the continuous disclosure documents filed by the Company on SEDAR at www.sedar.com. Readers are cautioned that the foregoing list of factors is not exhaustive of the factors that may affect forward-looking statements. Accordingly, readers should not place undue reliance on forward-looking statements. The forward-looking statements in this news release speak only as of the date of this news release or as of the date or dates specified in such statements.
Forward-looking statements are based on a number of assumptions which may prove to be incorrect, including, but not limited to, assumptions relating to: the availability of financing for the Company’s operations; operating and capital costs; results of operations; the mine development and production schedule and related costs; the supply and demand for, and the level and volatility of commodity prices; timing of the receipt of regulatory and governmental approvals for development projects and other operations; the accuracy of Mineral Reserve and Mineral Resource Estimates, production estimates and capital and operating cost estimates; and general business and economic conditions.
Investors are cautioned that any such statements are not guarantees of future performance and actual results or developments may differ materially from those projected in the forward-looking information. For more information on the Company, investors are encouraged to review the Company’s public filings on SEDAR at www.sedar.com. The Company disclaims any intention or obligation to update or revise any forward- looking information, whether as a result of new information, future events or otherwise, other than as required by law.
TABLE I - ASSAY RESULTS
| Hole ID | From | To | Length | Pd | Pt | Au | Ag | Cu | PdEq** | Mineralization |
|---|---|---|---|---|---|---|---|---|---|---|
| M* | ppm | ppm | ppm | ppm | % | ppm | Style | |||
| M-21-555 | 67 | 73 | 6 | 0.92 | 0.21 | 0.09 | 0.93 | 0.14 | 1.29 | Oxide Melatroctolite |
| And | 391 | 452 | 61 | 0.38 | 0.12 | 0.04 | 1.22 | 0.29 | 0.86 | Main Zone |
| Including | 391 | 401 | 10 | 0.69 | 0.22 | 0.07 | 1.68 | 0.39 | 1.37 | Main Zone |
| Also | 448 | 452 | 4 | 1.00 | 0.21 | 0.04 | 1.73 | 0.8 | 2.18 | Semi Massive Sulphides |
| M-21-556 | 61 | 69 | 8 | 0.70 | 0.19 | 0.04 | 0.18 | 0.06 | 0.92 | Oxide Melatroctolite |
| And | 91 | 99 | 8 | 0.53 | 0.09 | 0.04 | 0.30 | 0.07 | 0.70 | Oxide Melatroctolite |
| And | 299 | 329 | 30 | 0.35 | 0.16 | 0.05 | 1.15 | 0.26 | 0.82 | Main Zone |
| And | 362 | 372 | 10 | 0.17 | 0.10 | 0.06 | 0.58 | 0.11 | 0.42 | Main Zone |
| M-21-557 | 148 | 176 | 28 | 0.32 | 0.06 | 0.02 | 0.25 | 0.05 | 0.43 | Oxide Melatroctolite |
| And | 415 | 440 | 25 | 0.80 | 0.29 | 0.11 | 0.82 | 0.18 | 1.29 | Bornite (W-Type) |
| Including | 416 | 419 | 3 | 1.85 | 0.66 | 0.31 | 1.43 | 0.28 | 2.82 | Bornite (W-Type) |
| Also | 434 | 439 | 6 | 1.79 | 0.66 | 0.16 | 1.32 | 0.26 | 2.63 | Bornite (W-Type) |
| And | 500 | 522 | 22 | 0.30 | 0.09 | 0.04 | 1.05 | 0.21 | 0.66 | Main Zone |
| M-21-558 | 138 | 144 | 6 | 0.52 | 0.17 | 0.18 | 0.97 | 0.15 | 0.95 | Hangingwall |
| And | 156 | 160 | 4 | 0.43 | 0.07 | 0.04 | 0.45 | 0.07 | 0.59 | Oxide Melatroctolite |
| And | 170 | 174 | 4 | 0.41 | 0.08 | 0.03 | 0.30 | 0.05 | 0.54 | Oxide Melatroctolite |
| And | 182 | 188 | 6 | 0.38 | 0.07 | 0.03 | 0.33 | 0.05 | 0.51 | Oxide Melatroctolite |
| And | 427 | 443 | 16 | 0.75 | 0.68 | 0.05 | 0.61 | 0.05 | 1.25 | Bornite (W-Type) |
| Including | 427 | 431 | 4 | 2.40 | 1.72 | 0.12 | 0.25 | 0.02 | 3.51 | Bornite (W-Type) |
| And | 497 | 569 | 72 | 0.26 | 0.08 | 0.05 | 1.18 | 0.23 | 0.65 | Main Zone |
| Including | 499 | 513 | 14 | 0.44 | 0.16 | 0.09 | 2.43 | 0.36 | 1.07 | Main Zone |
| M-21-559 | 104 | 108 | 4 | 0.67 | 0.25 | 0.14 | 1.00 | 0.17 | 1.14 | Hangingwall |
| And | 140 | 152 | 12 | 0.25 | 0.06 | 0.03 | 0.62 | 0.11 | 0.46 | Oxide Melatroctolite |
| And | 373 | 455 | 82 | 0.37 | 0.12 | 0.07 | 1.51 | 0.26 | 0.83 | Main Zone |
| Including | 417 | 423 | 6 | 1.00 | 0.32 | 0.16 | 2.43 | 0.45 | 1.90 | Main Zone |
| M-21-560 | 112 | 114 | 2 | 1.36 | 0.29 | 0.10 | 0.8 | 0.16 | 1.81 | Oxide Melatroctolite |
| And | 324 | 355 | 31 | 0.40 | 0.14 | 0.05 | 1.49 | 0.26 | 0.86 | Main Zone |
| And | 424 | 456 | 32 | 0.37 | 0.10 | 0.05 | 1.19 | 0.25 | 0.79 | Main Zone |
| M-21-561 | 126 | 134 | 8 | 0.87 | 0.24 | 0.09 | 0.88 | 0.15 | 1.28 | Oxide Melatroctolite |
| And | 369 | 373 | 4 | 1.87 | 0.79 | 0.33 | 0.83 | 0.13 | 2.76 | Bornite (W-Type) |
| Including | 370 | 372 | 2 | 2.55 | 1.03 | 0.59 | 1.45 | 0.23 | 3.93 | Bornite (W-Type) |
| And | 407 | 413 | 6 | 0.71 | 0.42 | 0.02 | 0.10 | 0.01 | 0.98 | Main Zone |
| And | 441 | 455 | 14 | 0.67 | 0.24 | 0.06 | 0.36 | 0.07 | 0.94 | Main Zone |
| And | 473 | 509 | 36 | 0.43 | 0.11 | 0.05 | 1.10 | 0.25 | 0.85 | Main Zone |
* Drill intercepts lengths approximate true widths
** The Palladium Equivalent (“PdEq”) calculation expressed in g/t is the sum of the theoretical in situ value of the constituent metals (Au + Pt + Pd + Cu) divided by the value of one gram of palladium. The calculation makes no provision for expected metal recoveries or smelter payables. USD per ounce commodity prices of $1,725, $1,000, $1,400 were used, respectively, for Pd, Pt and Au and a $3.20/lb value was assigned for Cu.
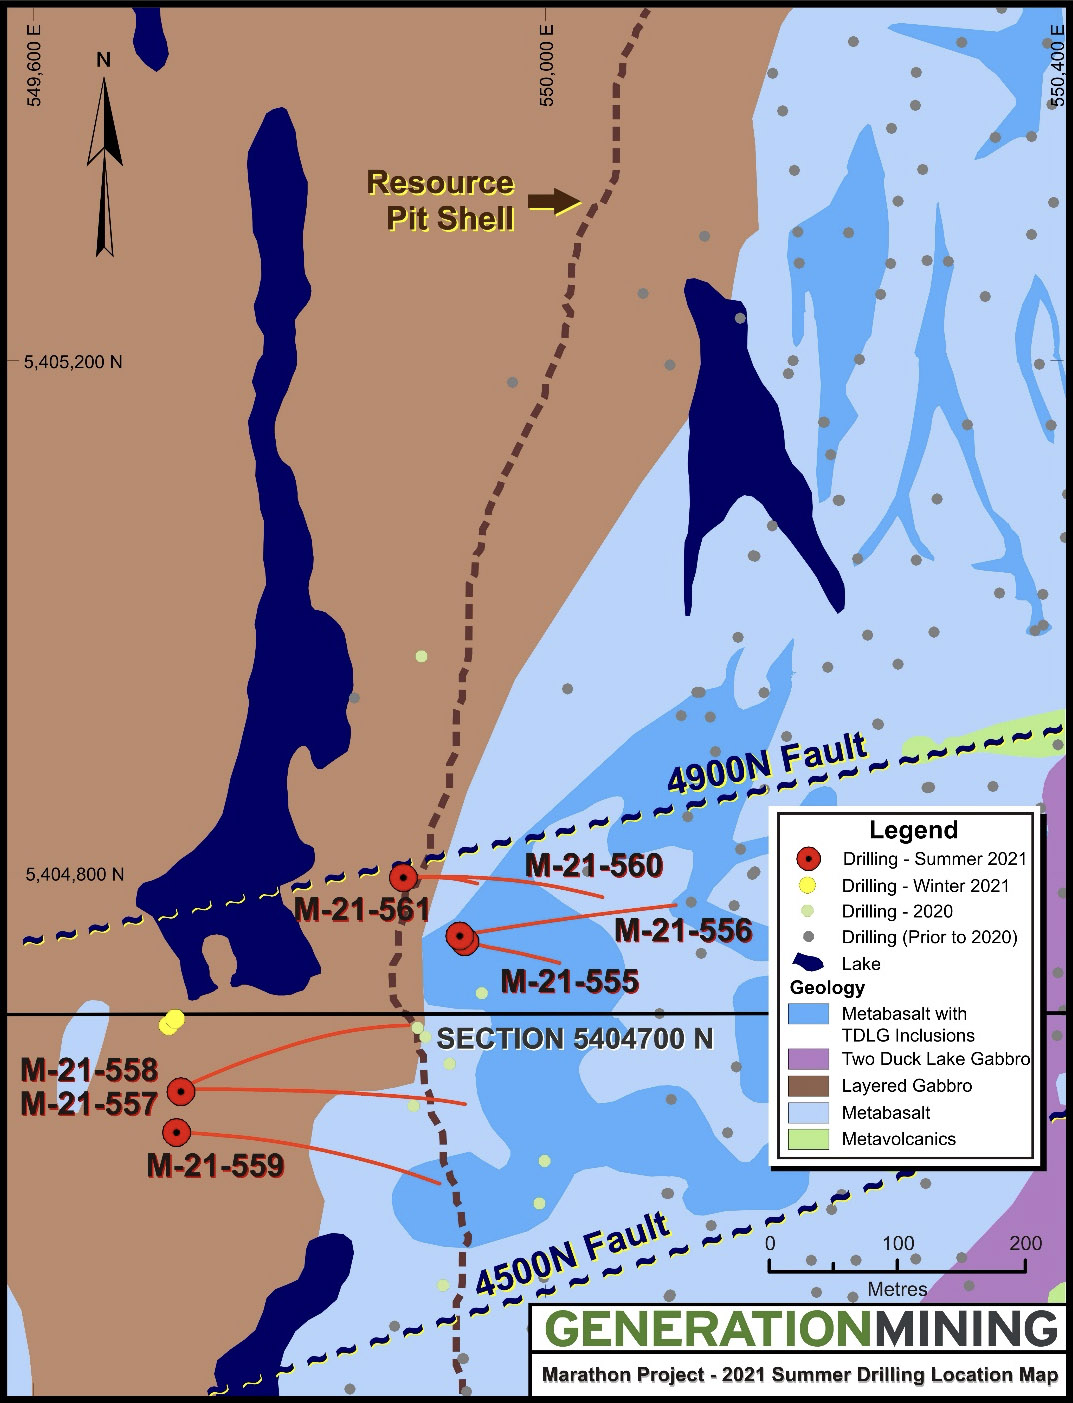
Figure 1: Western Margin of the Marathon Palladium Deposit - Central Feeder Zone Area showing 2021 Summer Drilling collar locations (M-21-555 to M-21- 561, inclusive) and the location of Cross Section 5404700N.

Figure 2: Central Feeder Zone - Marathon Palladium Deposit - Cross Section 5404700N
2021 Summer Drilling results, ML-555-21 to ML-561-21, inclusive.
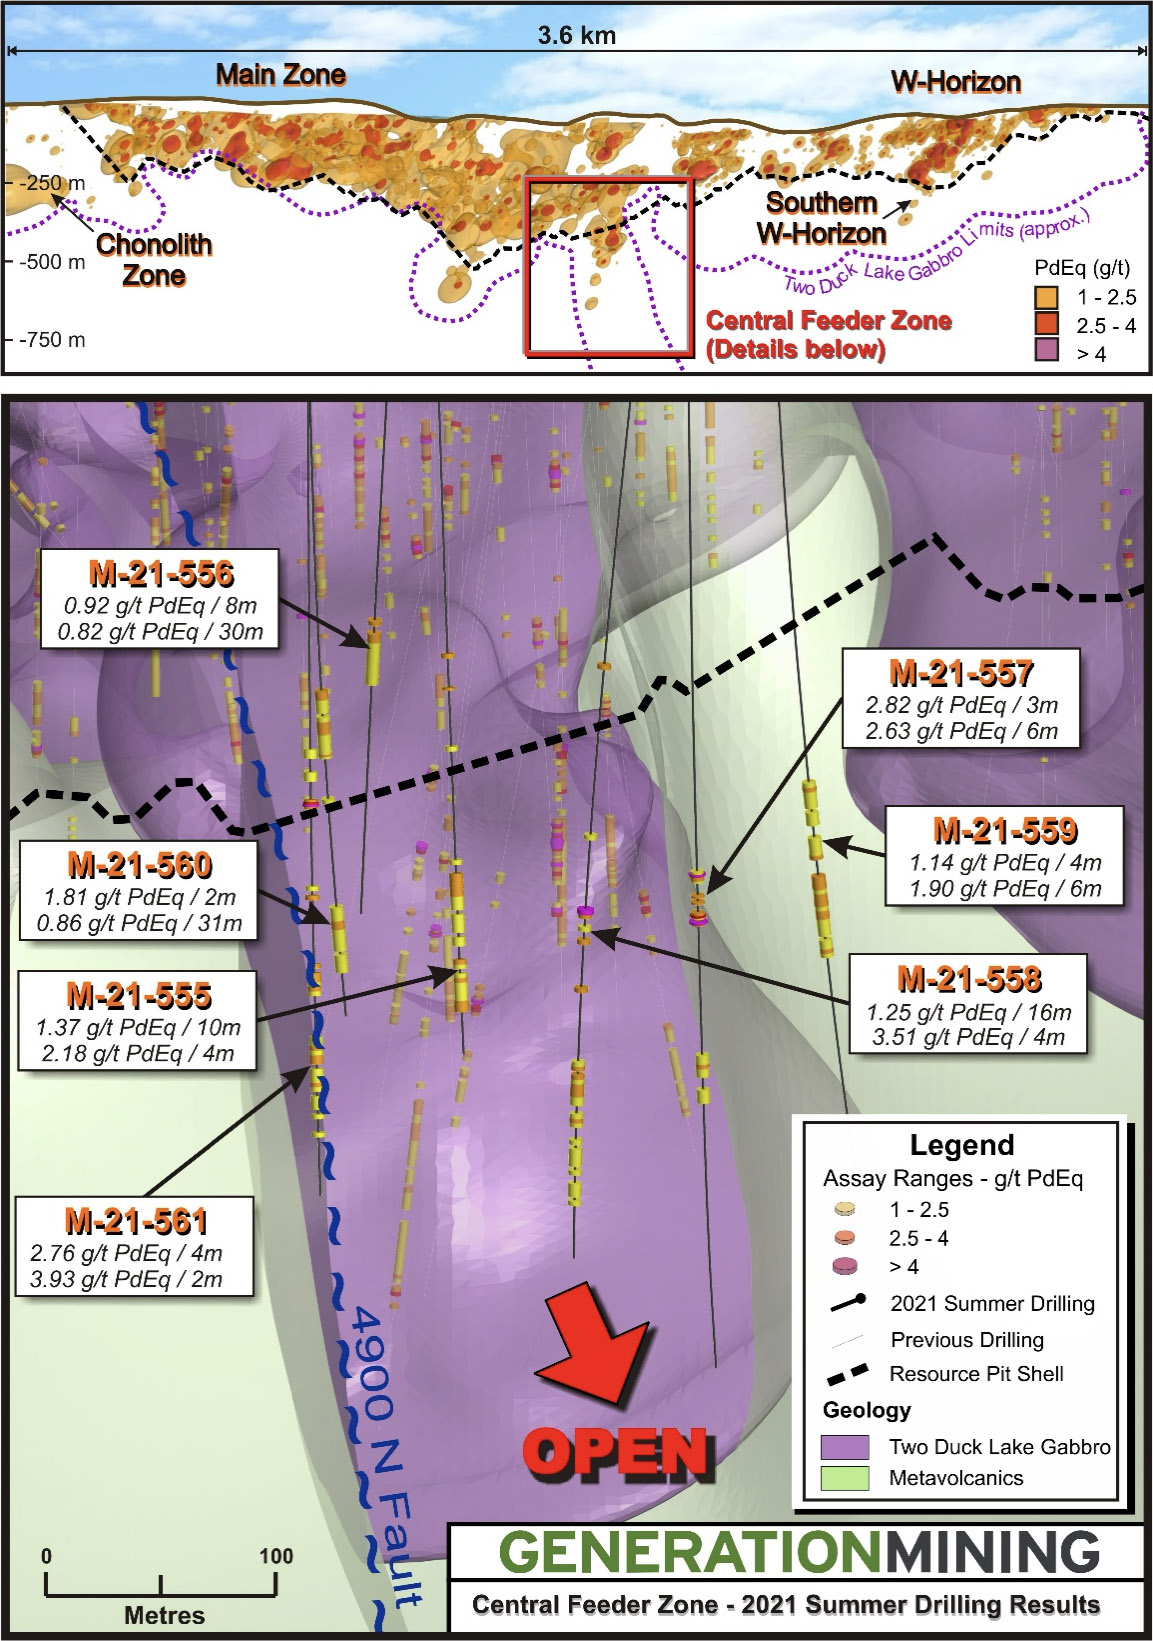
Figure 3: Schematic 3D Vertical Section of the Central Feeder Zone looking east and parallel to the plane of Section 5404700N; 2021 Summer Drilling results, ML-555-21 to ML-561-21, inclusive.